Reverberation Time RT60 Measurement
When room acoustics properties are at issue, the RT60 Reverberation Time solution represents an essential tool for obtaining accurate measurement results. The easy setup enables reliable measurement for effective modification of room parameters and easy achievement of desired reverberation time.
When room acoustics properties are at issue, the RT60 Reverberation Time solution represents an essential tool for obtaining accurate measurement results. The easy setup enables reliable measurement for effective modification of room parameters and easy achievement of desired reverberation time.
Reverberation Time RT60
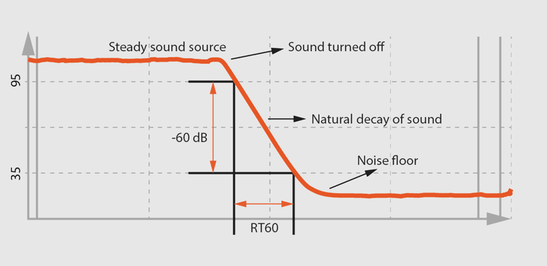
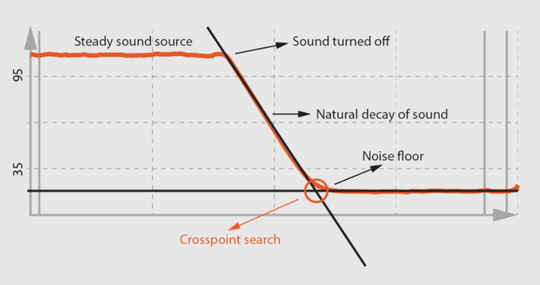
Reverberation time is the time required for the sound pressure level to fall for 60 dB from its initial level. Sound waves in a room will repeatedly bounce off reflective surfaces.
When these reflections mix with each other, a phenomena known as reverberation is created. Reverberation reduces when the reflections hit absorbent surfaces such as curtains, chairs and tables. Reverberation is a key parameter when qualifying the acoustic status of a room.
Evaluation Range
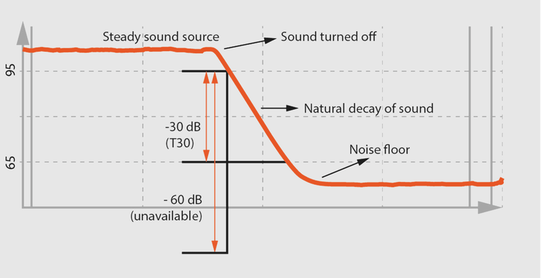
Reverberation time can be evaluated based on a smaller dynamic range than 60 dB and extrapolated to a decay time of 60 dB. The evaluation of the decay curve for each frequency band shall start at 5 dB below the initial sound pressure level. The bottom of the evaluation range should be at least 10 dB above the overall background noise of the measuring system.
T20 - derived from the time at which the decay curve first reaches 5 dB and 25 dB below the initial level.
T30 - derived from the time at which the decay curve first reaches 5 dB and 35 dB below the initial level.
T60 - derived from the time at which the decay curve first reaches 5 dB and 65 dB below the initial level.
Crosspoint Search
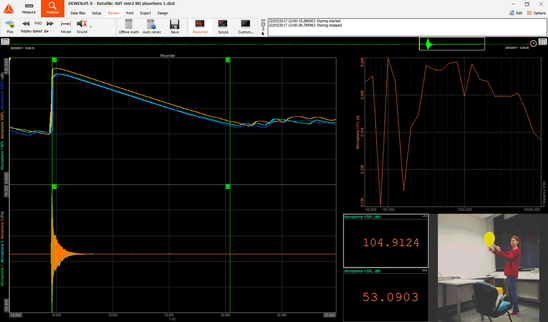
Use the improved algorithm for reverberation time estimation (Lundby algorithm) with an automatic search option.
Option manual will calculate the reverberation time from the first to the second locked cursor. It is important to place the first cursor on the right position, and the position of the second cursor will be found automatically.
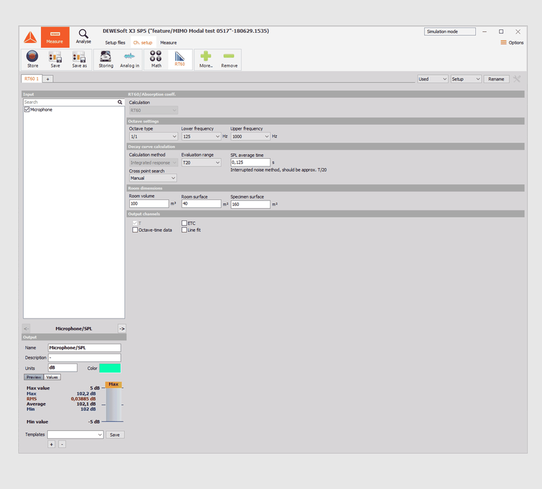
Calculated Output Channels
Reverberation time Math will calculate several parameters and output them as separated channels. The calculations are:
T - measured reverberation time
ETC - energy time curve
Octave Time Data - octave analysis type can be selected from 1/1 or 1/3 octave
Line Fit - fitted curve on energy time curve
Reverberation time Math will calculate several parameters and output them as separated channels. The calculations are:
T - measured reverberation time
ETC - energy time curve
Octave Time Data - octave analysis type can be selected from 1/1 or 1/3 octave
Line Fit - fitted curve on energy time curve
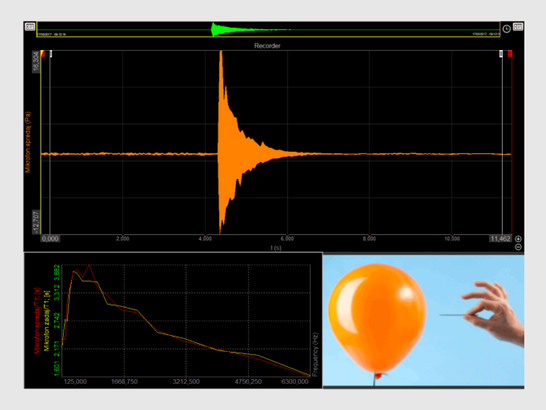
Integrated Response Method
The impulse response may be measured directly by using an impulse source such as a pistol shot, balloon burst, spark gap or any other sound source that produces an impulse with sufficient bandwidth and energy.
The impulse response may be measured directly by using an impulse source such as a pistol shot, balloon burst, spark gap or any other sound source that produces an impulse with sufficient bandwidth and energy.
Absorption Coefficient Calculation
The absorption (alpha) coefficient of a material indicated the proportion of sound which is absorbed by the surface compared to the proportion which is reflected back into the room.
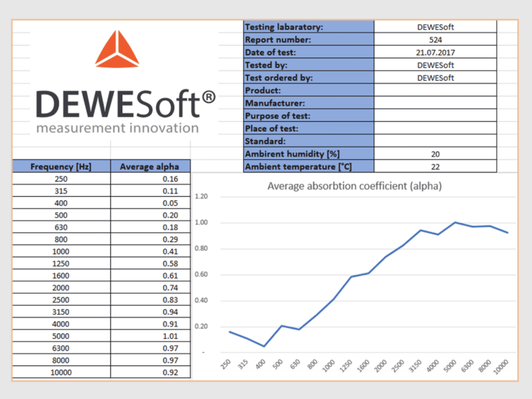
Provided Excel template contains formulas for averaging and calculation of absorption (alpha) coefficient. Enter the parameters about the room conditions and dimensions (temperature, humidity, volume, surface).
The absorption (alpha) coefficient of a material indicated the proportion of sound which is absorbed by the surface compared to the proportion which is reflected back into the room.
Provided Excel template contains formulas for averaging and calculation of absorption (alpha) coefficient. Enter the parameters about the room conditions and dimensions (temperature, humidity, volume, surface).
Analysis and Report Generation
The section in Excel template is dedicated to reporting. Alpha coefficient is calculated from reverberation times and other parameters that have to be entered (surface area of a test specimen, speed of sound, ...).
The result shown in the Excel template is the alpha coefficient for each frequency band and a graph of the alpha coefficient.