FFT Spectrum Analyzer & Frequency Analyzer
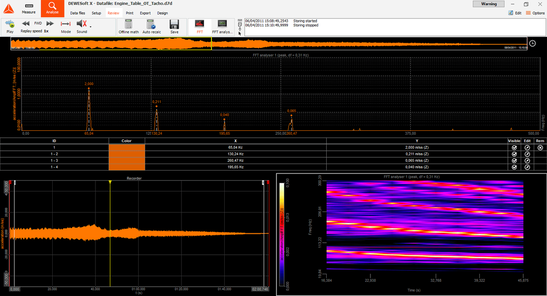
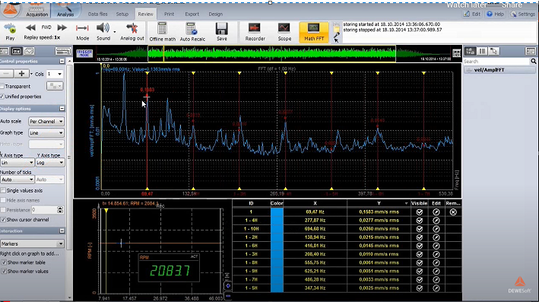
Dewesoft FFT spectrum analyzer has it all. Top performance, advanced cursor functions, high freely selectable line resolution, flexible averaging and advanced functions for in-depth frequency analysis.
Dewesoft FFT spectrum analyzer has it all. Top performance, advanced cursor functions, high freely selectable line resolution, flexible averaging and advanced functions for in-depth frequency analysis.
FFT Spectrum Analyzer Overview - Performance & Flexibility
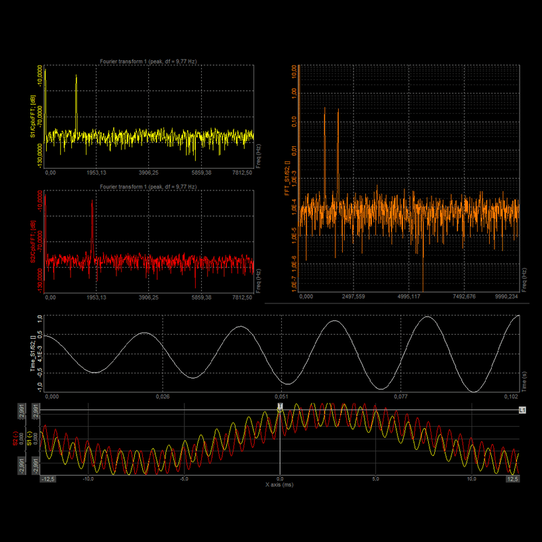
Dewesoft FFT spectrum analyzer provides all main functions for spectral analysis with advanced averaging, selectable resolution (64,000 lines and more) or direct specification of the bandwidth (e.g. 0.01 Hz). Multiple channels can be displayed and analyzed in one FFT analyzer instrument for easy comparison.
It offers either real-time direct online frequency spectrum analysis during the measurement or offline frequency analysis on the stored data.
Multipurpose Frequency Cursor Functions
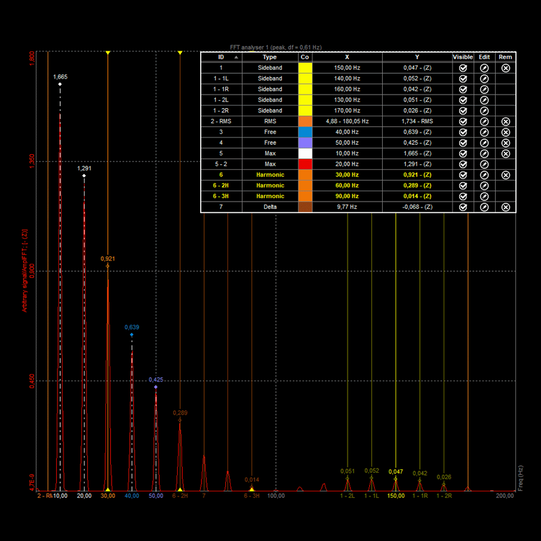
Dewesoft FFT analyzer allows setting multiple markers for automatic detection of different parameters. Our frequency analyzer offers the following markers:
Free marker: free markers can be freely added. The marker shows us the frequency of the peak at which it stands and its amplitude.
Maximum marker: the maximum marker finds the highest amplitude in the spectrum.
RMS marker: RMS marker will sum up all the FFT lines in the selectable band and calculates the RMS value.
Sideband marker: the sideband marker monitors the modulated frequencies to the left and right from the selected centerline.
Harmonic marker: the harmonic marker is a great help when identifying the fundamentals of the frequency.
Damping marker: damping markers are best to use in modal testing when we want to find out how our transfer curve is damped. We select it when we are interested in the quality factor, damping ration or attenuation rate of a selected peak.
Delta marker: shows the difference in channel values between two positions of the marker.
Zoom marker: with zoom marker you can easily zoom into the selected region of a channel.
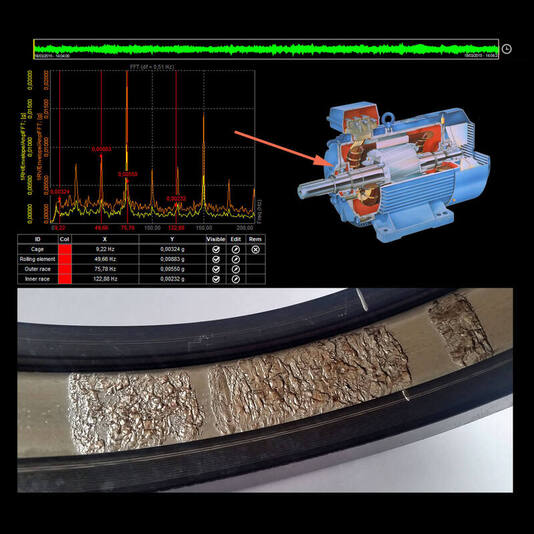
Bearing cursor: identify the bearing frequencies (envelope detection).
FFT Analysis Settings
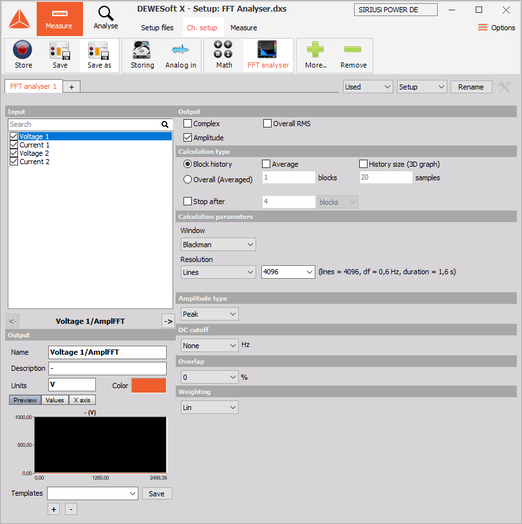
Dewesoft FFT analyzer module allows several parameters to be set up before the calculation:
Output channels - complex, amplitude, overall RMS
Calculation type - block history or overall
Windowing - Rectangular, Hanning, Hamming, Flattop, Triangle, Blackman, Exponent down, Transient
Resolution - up to 64000 lines (64k)
Amplitude type - peak, peak-peak, RMS, PSD, Power
DC cutoff - remove DC or low-frequency components
Overlap - define the percentage of time signal that has already been calculated and it is used again for calculation
Weighting - calculate the sound weighting in the frequency domain (A, B, C, D)
Averaging type - linear, exponential, peak-hold
Bearing Fault Detection
Envelope detection is a procedure for early detecting of faults on ball bearings.
When a failure of the ball bearing occurs, it will produce ringing with a frequency which corresponds to its natural frequency. This ringing will repeat each time when a damaged part of the ball hits the ring or vice versa. We have to know also that inner ring, outer ring, cage and balls have different typical repeating frequency depending on the geometry of the bearing and the rotational frequency.
Short-time Fourier Transform (STFT)
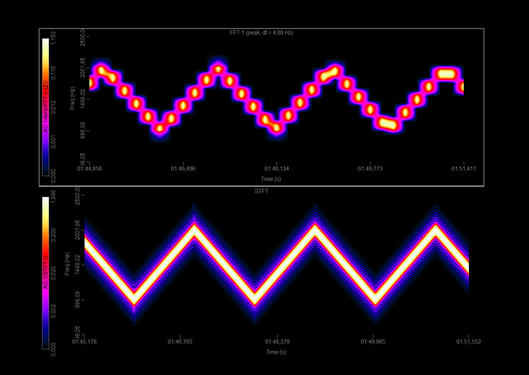
Short-time Fourier transform or shorter STFT is a well-known technique in signal processing to analyze non-stationary signals. STFT is segmenting the signal into narrow time intervals and takes the Fourier transform of each segment.
When the signal changes fast, you need a small time to calculate the frequency spectrum faster. But you still want better frequency resolution and here STFT comes in place (we get 16 times better frequency resolution for the same time frame).
Full Spectrum
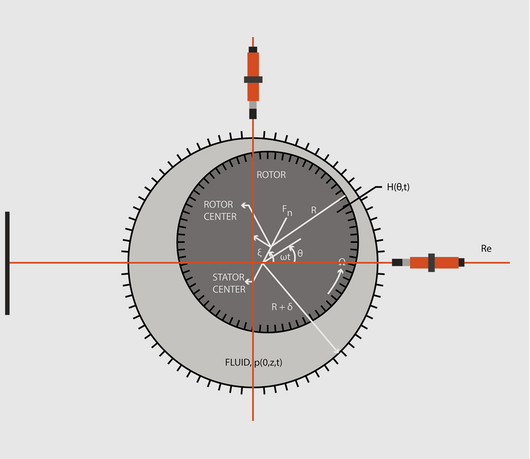
Used for signal modulation, signal demodulation and rotor whirl analysis.
The single value or block history / windowing / overlap and DC cutoff
Used for signal modulation, signal demodulation and rotor whirl analysis.
The single value or block history / windowing / overlap and DC cutoff
Cepstrum Analysis
The cepstrum analysis calculation (also used to determine characteristics in speech analysis) helps to identify vibration signatures, such as frequencies in the gearbox and bearing analysis. Dewesoft provides mirror spectrum, low and high frequency output.
selectable block size / windowing / liftering / overlap and overaging
Video below shows Cepstrum math being used on a microphone input signal to determine the speaker's name.
Auto-Spectrum & Cross-Spectrum
Power spectral density (PSD) is the measure of the signal's power content versus frequency. A PSD is typically used to characterize broadband random signals. The amplitude of the PSD is normalized by the spectral resolution.
Power spectral density (PSD) is the measure of the signal's power content versus frequency. A PSD is typically used to characterize broadband random signals. The amplitude of the PSD is normalized by the spectral resolution.

