Charging Profile, Time & Efficiency
The data logging capability of Dewesoft Power Analyzer allows recording the complete charging process.
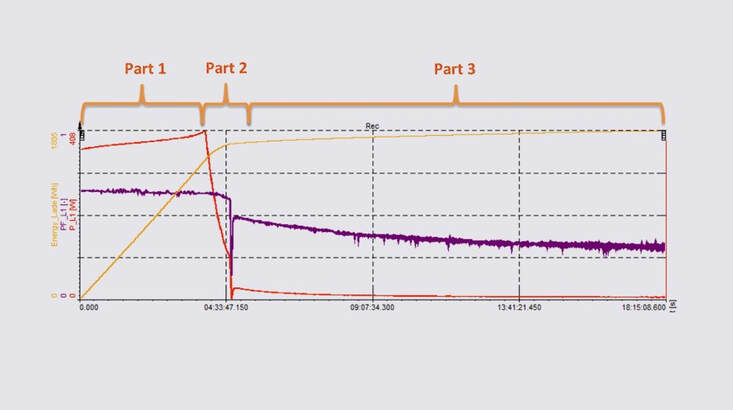
Example photo shows analyzing charging profile (red = charging power, orange = energy, violet = power factor):
Charging part 1: Continuous charging with high power. Within 4 hours 80 % of the battery is charged.
Charging part 2: Reaching of the charging end voltage and short interruption, 86% charged.
Charging part 3: The last charging part with low power. Within 14 hours battery is fully charged.

