Renewable Energy Testing Solutions
Dewesoft Power Analyzer allows a comprehensive analysis of renewable generation units according to FGW-TR3, VDE-AR4105, BDEW standards. Highly flexible hardware and innovative software save a lot of time during the testing process.
Dewesoft Power Analyzer allows a comprehensive analysis of renewable generation units according to FGW-TR3, VDE-AR4105, BDEW standards. Highly flexible hardware and innovative software save a lot of time during the testing process.
Testing System Overview
Renewable power plants like wind, photovoltaic (PV) and CHP (Combined Heat and Power Plant) are more and more popular and the amount of already installed units is huge. For the operation at the public grid these renewable power generation units have to fulfill a couple of requirements to contribute to a stable operation of the grid.
The standards, which define the conditions for operating the plant at the grid, vary from country to country: e.g FGW-TR3, VDE-AR4105, BDEW etc. These regulations define the control of the active an reactive power, the limits of Power Quality emissions and the behavior at grid disturbances.
One System. All the Measurements
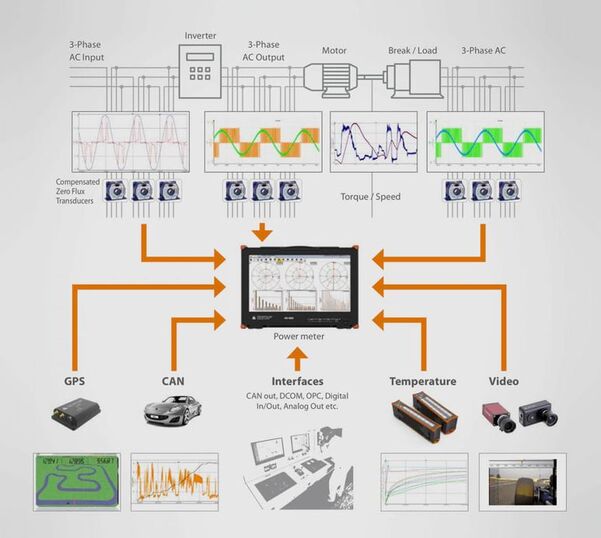
Testing according to these regulations requires a couple of different test procedures and different test equipment. The Dewesoft solution allows wide range analysis according to these standards with a single instrument.
Special factors like flicker step factor, voltage change factor, symmetrical components, period values for P, Q, S, U, I (for half-wave or full-wave) etc. are calculated in the software. The recorder allows creating all necessary graphs with the different parameters (e.g. P-f chart).
The data logging capability allows storing the raw data for analyzing the switching processes or the behavior at faults (Waveform analysis). The Math library can calculate any statistical parameter (e.g. max, active power for 0.2s, the 60s and 600s) and also offers the possibility to automatically check if the power generation unit meets the requirements.
Active & Reactive Power
Active Power Calculation
Max active power for 0.2s, 60s and 600s
Input and output power (DC, AC)
Operation at Different Set Point Settings for Active & Reactive Power
Calculation of deviation, min, max, average values for each set point
Automatic check if within range
Transient behavior
Different charts ((P, Q, S, U, I, f, cos phi)
Power Reduction at Increasing Frequency
Check if power reduction within tolerance
Calculation of gradients (% Hz) and power difference
Different charts (P, U, I, f)
Evaluation of Reactive Power Provision
Q_ind, Q_cap, Power Factor
The voltage of positive sequence-system
Power Quality
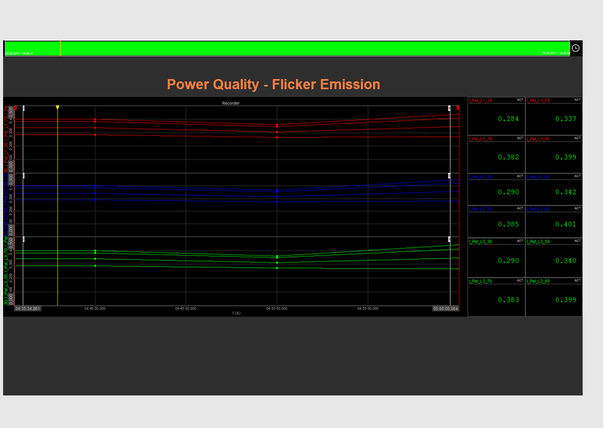
Flicker
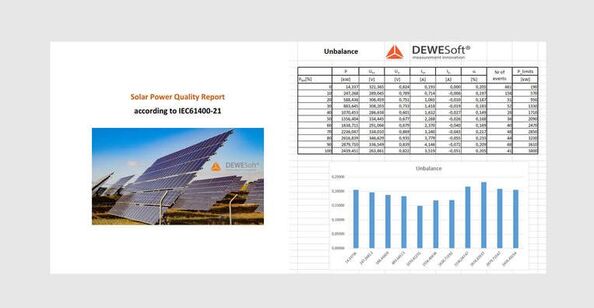
Flicker coefficient (c) at different phase angles (30, 50, 70, 85) according to IEC 61400-21
DC input power, reactive output power
Switching Operations
Period values of P, Q, S, Urms, Irms (with overlap)
Flicker step factor (kf) and voltage change factor (ku) at different phase angles (30, 50, 70, 85) according to IEC 61400-21
Harmonics, Interharmonics and THD
Calculation up to 50th order for U, I, P, Q, Z and phi
Full and half-sidebands
Harmonic smoothing filter
Higher Frequencies
Higher frequencies from 2 to 9 kHz in 200 Hz bands (possible up to 150 kHz)
Behavior at Faults
Dis- and Reconnection Tests
Test of protection equipment - Check Settings, and dis- and reconnection time for over and under-voltage, over- and under-frequency
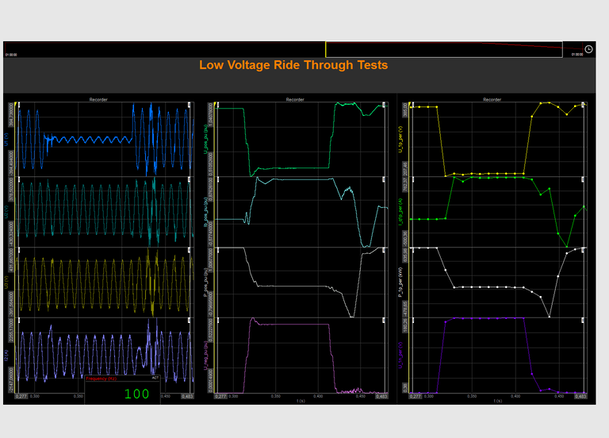
Behavior at Grid Disturbances (LVRT - Low Voltage Ride Through)
Raw data analysis (waveform) at start and end of the fault
Analysis of fault length and specification of short-circuit current (peak value, 1/2 period value) at different times (t=0, t=150 ms, etc)
Calculation of normalized active- reactive- and apparent power
Half-wave RMS values for voltages & currents
Positive-, negative and zero-sequence voltages
Active-, reactive- and apparent power of positive-, negative- and zero- sequence-system
Typical DAQ Configuration
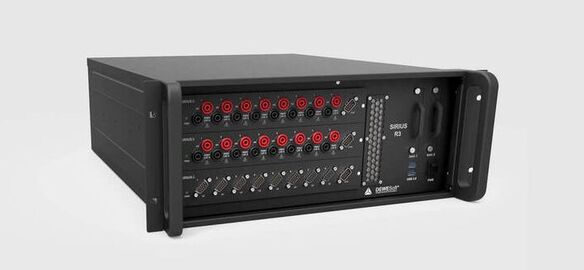
We recommend R3 DAQ system as a typical configuration for renewable energy measurements configured with:
6 x high-voltage analog inputs
6 x current analog inputs
1 x low voltage analog input for set point value
We recommend R3 DAQ system as a typical configuration for renewable energy measurements configured with:
6 x high-voltage analog inputs
6 x current analog inputs
1 x low voltage analog input for set point value


