Condition Monitoring Software
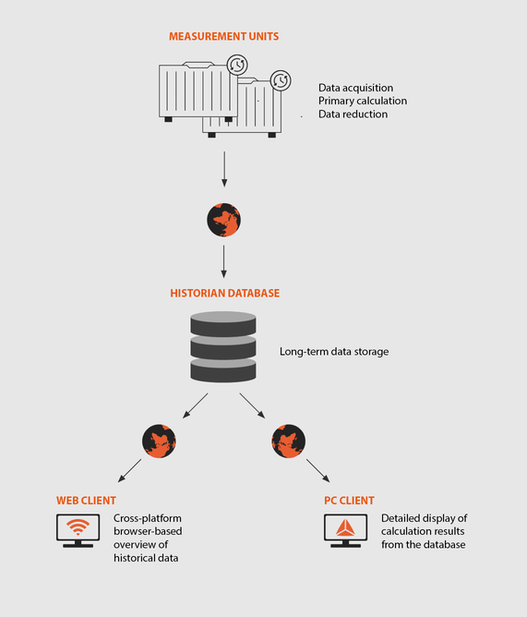
Dewesoft machine condition monitoring software is unique on the market. It combines PC Client software, a high-level Web-based software layer with an overview of the machinery state and Historian time-series database for permanent storage of the data.
Dewesoft machine condition monitoring software is unique on the market. It combines PC Client software, a high-level Web-based software layer with an overview of the machinery state and Historian time-series database for permanent storage of the data.
Software Architecture Overview
Calculation on raw data is performed on measurement units running Dewesoft software offering thousands of features including:
Integration (acceleration to velocity) or derivation (displacement to velocity) of any acquired channel
Low and high pass filters
Order tracking (cont. & run-up / shut-down)
Envelope detection
Tracking filters
Octave band analysis
Torsional, rotational vibration
Measurement units can either provide raw data for further display and calculations to the Client PC or in a reduced format to the Historian Database for permanent storage.
Historical data available in the Historian time database can be displayed using the Web Client or PC Client. The web client interface is accessible from any web browser, making it a cross-platform and mobile solution. It provides an overview of the most important machine health data and its trend over time. It also provides email alerts.
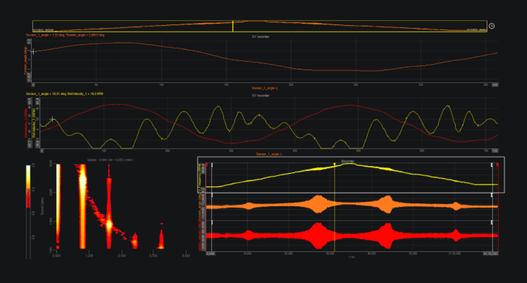
PC Client is running a standard Dewesoft Machine Condition Monitoring Software offering a detailed display of calculation results from the database including:
Acceleration, Velocity and Displacement Measurements
3D Spectrum Trend
Envelope Detection
Run up / Coast down Analysis
Torsional and Rotational Vibration Analysis
Octave Band Analysis
Machine Elements Identification
Calculation on raw data is performed on measurement units running Dewesoft software offering thousands of features including:
Integration (acceleration to velocity) or derivation (displacement to velocity) of any acquired channel
Low and high pass filters
Order tracking (cont. & run-up / shut-down)
Envelope detection
Tracking filters
Octave band analysis
Torsional, rotational vibration
Measurement units can either provide raw data for further display and calculations to the Client PC or in a reduced format to the Historian Database for permanent storage.
Historical data available in the Historian time database can be displayed using the Web Client or PC Client. The web client interface is accessible from any web browser, making it a cross-platform and mobile solution. It provides an overview of the most important machine health data and its trend over time. It also provides email alerts.
PC Client is running a standard Dewesoft Machine Condition Monitoring Software offering a detailed display of calculation results from the database including:
Acceleration, Velocity and Displacement Measurements
3D Spectrum Trend
Envelope Detection
Run up / Coast down Analysis
Torsional and Rotational Vibration Analysis
Octave Band Analysis
Machine Elements Identification
Dewesoft Historian - Database Storage
The historian software package provides a time series database for long term data storage. The database can be either located locally, on the remote server or in the cloud. The solution is based on the InfluxDB time-series database open source project.
Historian provides several useful features for your historic data:
- Raw and Reduced data: while raw data is always stored on the measurement unit for an in-depth analysis, Historian takes the role of long-term reduced data storage into the cloud database.
- Data Safety & Retransmit: If the connection between the measurement hardware and the database is lost, the data is safely stored locally on the measurement unit and then retransmitted to the database when the connection is available.
- Trending & Analysis: Historical data can always be recalled and loaded from the Historian database and used for trend analysis as well as for in-depth analysis and root cause identification.
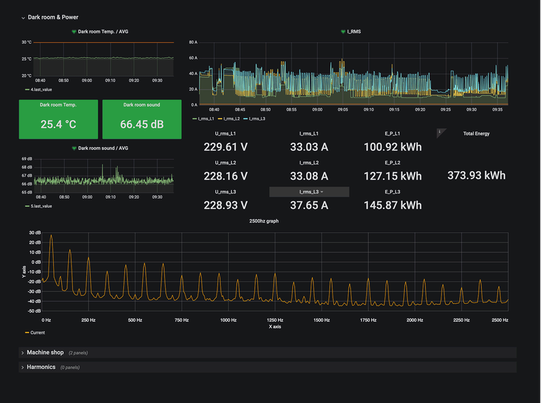
Web Client For Overview & Alerts
The web client interface is accessible from any web browser, making it a cross-platform and mobile solution. It provides an overview of the most important machine health data and its trend over time.
Alarm and alert levels can be set on each display and tied to email / SMS notifications.
The solution is based on the Grafana open source project which was enhanced by Dewesoft to support features like vector display (FFT) and selective loading of historical data which dramatically speeds up the loading of long term data in the displays.
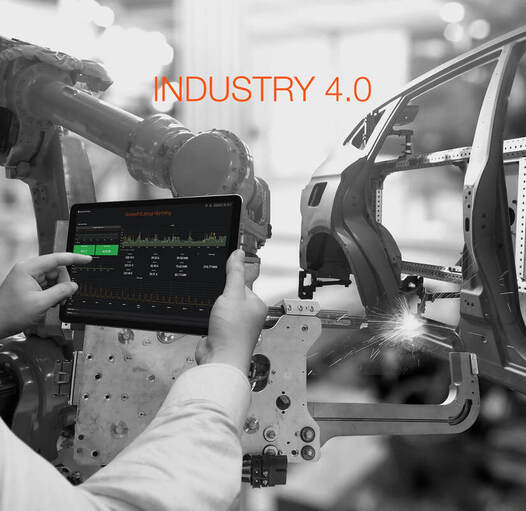
Industry 4.0 (IIoT) Connectivity with OPC UA
Cloud Software
Cloud Software infrastructure is available for graphical representation of the machine state. Visualization and monitoring technology of long-term trends is available. On top of that thresholds and alarms are available to be used in combination with e-mail or SMS notifications.
The user interface can be easily customized according to customer's requirements. The data is streamed from Dewesoft DAQ software running on the local PC over OPC into a database. The database can run on a local server or in the cloud.
SCADA
Data transfer from Dewesoft to SCADA is straightforward by using the Dewesoft OPC UA Server or Client modules. In this case, Dewesoft software acts as a SCADA server or client, depending on the requirements set by the customer.
Industrial Communication Protocols
Several industrial interfaces and protocols are open either to serve or read data. OPC UA, Siemens S7, MODBUS, Serial communication and EtherCAT/Ethernet communication protocols are supported as optional upgrades.
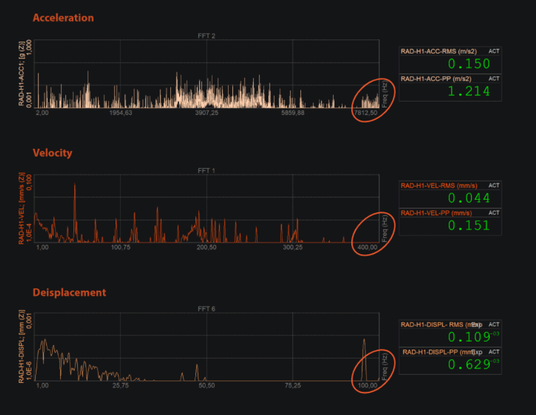
Acceleration, Velocity & Displacement
Any number of the acquired channel can be integrated (acceleration to velocity etc.) or derived (displacement to velocity etc.). Acceleration, velocity and displacement channels are preconfigured for machine monitoring needs.
The software offers a very simple way to display and visualize acceleration, velocity and displacement waveform and spectrum plots, all in real-time.
Integration and derivation channels can be reconfigured in detail:
- Freely settable high-pass and low-pass filters (type, order, frequency)
- Freely settable sampling and FFT resolution for each signal - enables high frequency resolution in the band of interest with a low number of lines
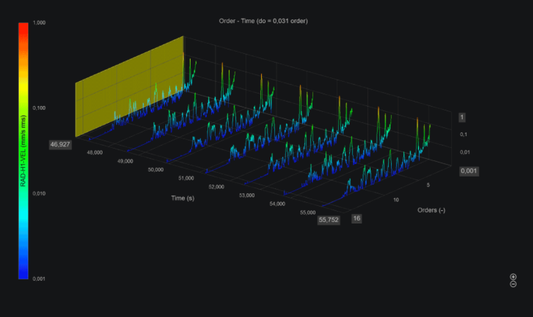
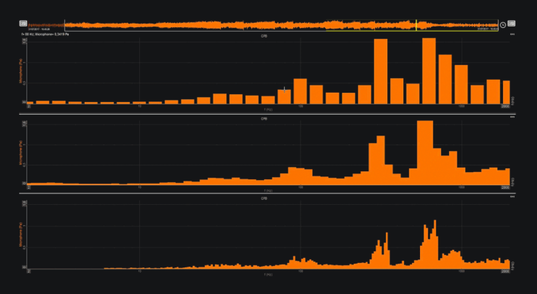
Spectrum Trend 3D Graph
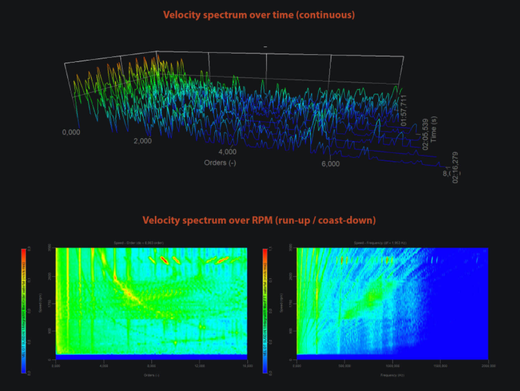
Frequency spectrum data over time represents key information about the machine's behavior. A 3D graph visual component is, therefore, an indispensable tool for continuous condition monitoring.
Both frequency and order domains can be displayed on the 3D graph.
Advanced 3D graph functionalities include:
Linear or logarithmic amplitude scale
Surface or line representation
Full time history or selected time interval display
Continuous & Run-up / Coast-down Monitoring
The order tracking software module supports both typical analysis types:
The monitoring software automatically detects the operation mode and provides order domain data over time during continuous operation and over RPM during run-up and coast-down.
Order amplitude values over time or over RPM can be extracted in their own channels that can be used for further computation.
The order tracking software module supports both typical analysis types:
- Continuous - constant RPM
- Run-up / Coast-down - increasing / decreasing RPM during machine start and stop routines
The monitoring software automatically detects the operation mode and provides order domain data over time during continuous operation and over RPM during run-up and coast-down.
Order amplitude values over time or over RPM can be extracted in their own channels that can be used for further computation.
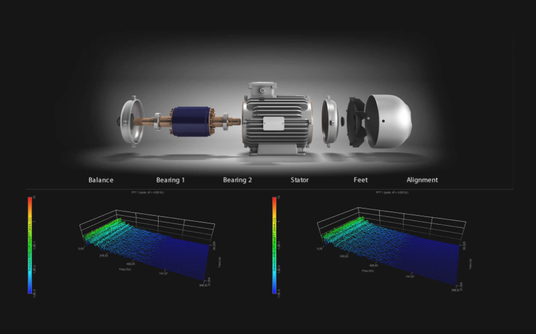
Frequency Spectrum Machine Elements Identification
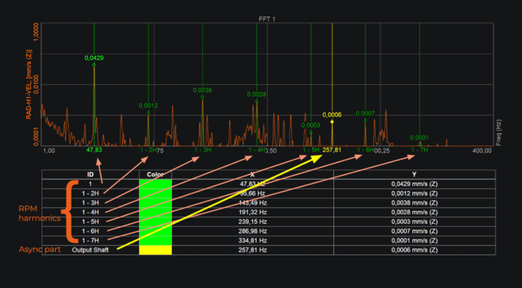
The software allows for simple identification of machine parts in the frequency spectrum:
Input and output shafts
Bearings
Gears
Machine parts are defined by their characteristic multiplier of the base RPM. Harmonic markers help distinguish between harmonic and base frequencies.
Markers can be used with any quantity on the horizontal axis:
Frequency in Hz
Rotational speed in RPM or CPMOrder
Bearing & Gear Analysis
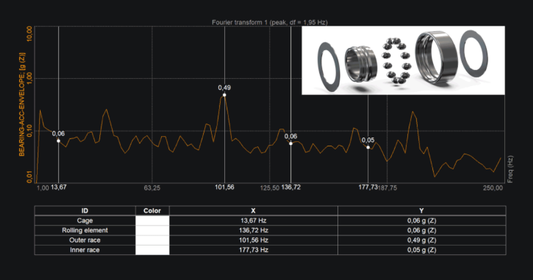
Enveloped acceleration is used to demodulate high-frequency acceleration spikes into the characteristic bearing and gear mesh frequencies.
A large database of bearings is readily available and open to additional entries by the user.
The software module identifies the frequencies of interest in the spectrum for each part of the bearing.
Envelope Detection - Energy & Peak Available
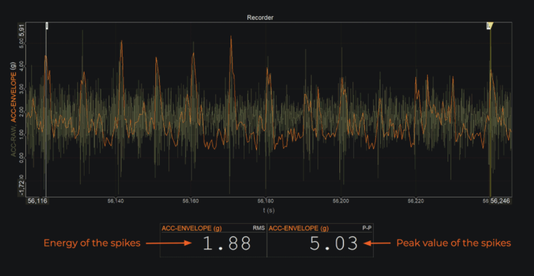
The envelope detection algorithm is highly configurable:
Envelope signal can be displayed in any of the plots:
Time Waveform
Frequency spectrum with Hz or RPM on the horizontal axis
Order Spectrum
The envelope detection algorithm is highly configurable:
- No limit on high-pass filter frequency - especially suitable for low speed rotating machinery in combination with Dewesoft ASI-1xVIB acceleration sensor with 0 Hz to 10 kHz flat frequency response.
- Both RMS and PEAK values can be calculated, representing the energy of the spikes (RMS) or the peak value of the spikes (PEAK).
Envelope signal can be displayed in any of the plots:
Time Waveform
Frequency spectrum with Hz or RPM on the horizontal axis
Order Spectrum
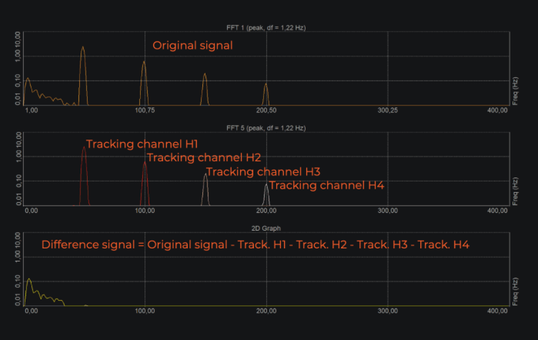
Tracking Filters - Advanced Spectrum Analysis
Tracking filters allow you to track specific orders of the rotating frequency.
This allows to only extract the signal around a specific order band into a separate channel.
The extracted channel can be converted into the frequency domain and subtracted from the original spectrum. This allows the user to remove frequency bands specific to a certain machine part from the spectrum in a separate channel.
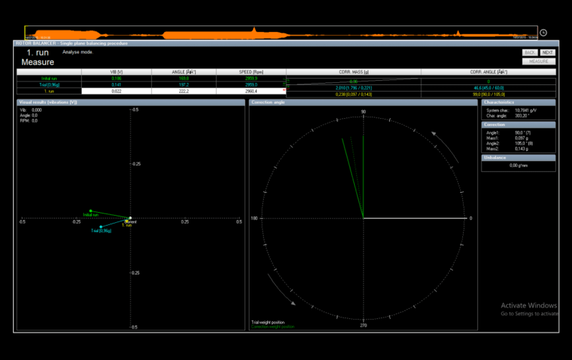
Rotor Balancing
After the monitoring software detects unbalance, Dewesoft software offers a rotor balancer module that provides intuitive step-by-step approach to balance the rotors:-
Single or dual-plane balancing on-site
Simple step-by-step procedure
Rich visualization
Weight splitting
Storage of influence vectors
Octave Band Analysis
Octave band analysis is used for condition monitoring based on a machine sound footprint over a wide frequency range. Dewesoft octave analysis solution meets all the IEC and ANSI Class 1 specifications for octave filters.
Octave Band Analysis core features:
True octave analysis
Synthesized analysis
Resolution up to 1/24 octave
Frequency sound weighting
Frequency averaging
Torsional & Rotational Vibration
Torsional vibrations are quite often a source of issues and faults on long shafts. Rotational and torsional vibration module provides in-depth analysis into torsional angle behavior between two ends of a shaft as well as into vibration of the rotating velocity.
Easy sensor setup - no need for the same sensor type on both ends
Access to all data - resulting channels used in further calculation
Advanced math - input filters, rotational DC filters order tracking integration