Order Tracking Analysis
Order tracking analysis is a tool to determine the operating condition of the rotating machines such as resonances, stable operation points, determining a cause of vibrations. Dewesoft provides a flexible order analysis software and data acquisition hardware for every rotating machinery and rotor dynamics.
Order tracking analysis is a tool to determine the operating condition of the rotating machines such as resonances, stable operation points, determining a cause of vibrations. Dewesoft provides a flexible order analysis software and data acquisition hardware for every rotating machinery and rotor dynamics.
Order Analysis
Order analysis is a technique for analyzing noise and vibration signals in rotating or reciprocating machinery (engines, compressors, turbines and pumps).
These machines have a variety of parts, each of which contributes unique and vibration patterns to those of the whole machine.
With order analysis, you can identify and isolate these patterns to analyze the performance and quality of each machine part individually.
Order Tracking FFT Setup
The order tracking module allows you to select several options before starting the test:
Order FFT vs. Time - monitors orders over time and not only the current values.
Order FFT vs RPM - Monitors current values of orders.
Order Domain Harmonics - Complex channels displayed on a2D graph (we define which harmonics we want to extract).
But don't worry, you can always change these settings after you have recorded your measurement. Since Dewesoft X stores the raw data all parameters can be changed and results recalculated in the offline mode.
Select the RPM limits (upper and lower RPM limit), and whether you want to calculate the waterfall spectrum and order extraction while run-up, while coastdown or both (to cover the whole frequency spectrum).
Delta RPM will define when a new update of the waterfall spectrum and also the extracted order domain harmonics are calculated. In case, the RPM is not changing only channels from Time FFT setup can be calculated according to the maximum time limit setting.
Time FFT Setup
The order tracking module creates a waterfall plot out of the RPM change. So every time the RPM changes for the defined delta RPM, an FFT is calculated for that data block and shown in the Time FFT diagram.
FFT waterfall vs. RPM - monitors calculated FFT
Time domain harmonics - complex output channel showing the amplitude of harmonics in a time domain
Campbell Diagram
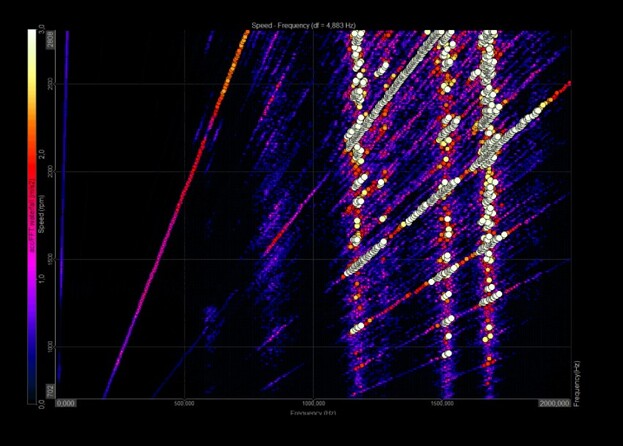
Visualization of 3-dimensional values on a single plane is mostly used in order tracking analysis applications. A Campbell diagram plot represents a system's response spectrum as a function of its oscillation regime.
The range of values is segmented in a defined number of levels and each level is represented by a circle, whose radius and color depend on level's index. Bigger values are represented with larger circles and colors higher on the color map. For a better analysis of data, a cutoff of lower levels can be applied.
Data Averaging and Update Criteria
Based on the delta RPM (e.g. 50) the RPM range is split into blocks / classes - e.g. 2050, 2100, 2150, etc. Depending on the situation the user can decide of the result is placed at the center of the block or averaging should be done between blocks (noisy situations).
Based on the delta RPM (e.g. 50) the RPM range is split into blocks / classes - e.g. 2050, 2100, 2150, etc. Depending on the situation the user can decide of the result is placed at the center of the block or averaging should be done between blocks (noisy situations).
Orbit Plot Analysis - Visualize Movement of a Rotating Disc
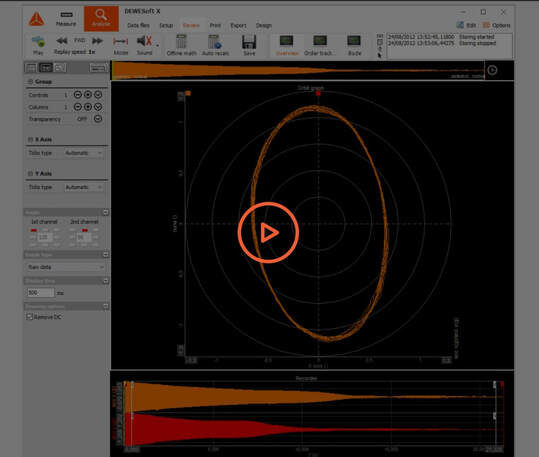
The orbit analysis graph is a visual control where you can visualize the movement of a rotating disc.
The orbit analysis plot shows the rotational direction of the shaft. The arrow that shows the direction of rotation is displayed in the top right corner of the graph.
The direction of the arrow is CCW (counter-clockwise), therefore we need to choose the channels on-orbit graph in the right sequence.


